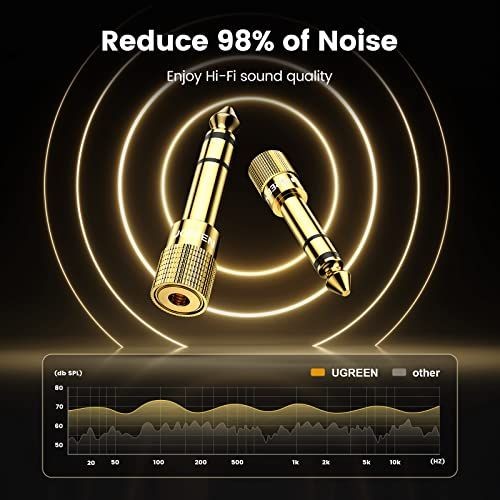
A high-contrast 1:1 graphic comparing signal noise reduction performance between an audio adapter and standard alternatives.
Free credits included. No card required
This audio adapter ad succeeds by using a clear data visualization to establish authority. By quantifying performance benefits with a specific noise reduction percentage, the creative instantly validates the product value to a technical audience.
This structure effectively builds trust before the user even reads the headline. Promer AI often sees this pattern perform well in crowded niches where technical specs are the primary differentiator between competing accessories.
Great ads translate complex technical specifications into visual truths that even a casual listener can immediately understand.
Pro tip
When displaying performance graphs, ensure the baseline Comparison data is clearly labeled. This transparency prevents the chart from looking like an arbitrary marketing claim and builds stronger consumer trust.
















Promer helps you find the pattern, adapt it to your product, and create your own version in minutes.